Wall St Tumbles, Led by Chipmakers; S&P Lowest Since May
The S&P 500 lost 22.08 points, or 1.15 percent, to 1,906.13

The S&P 500 lost 22.08 points, or 1.15 percent, to 1,906.13
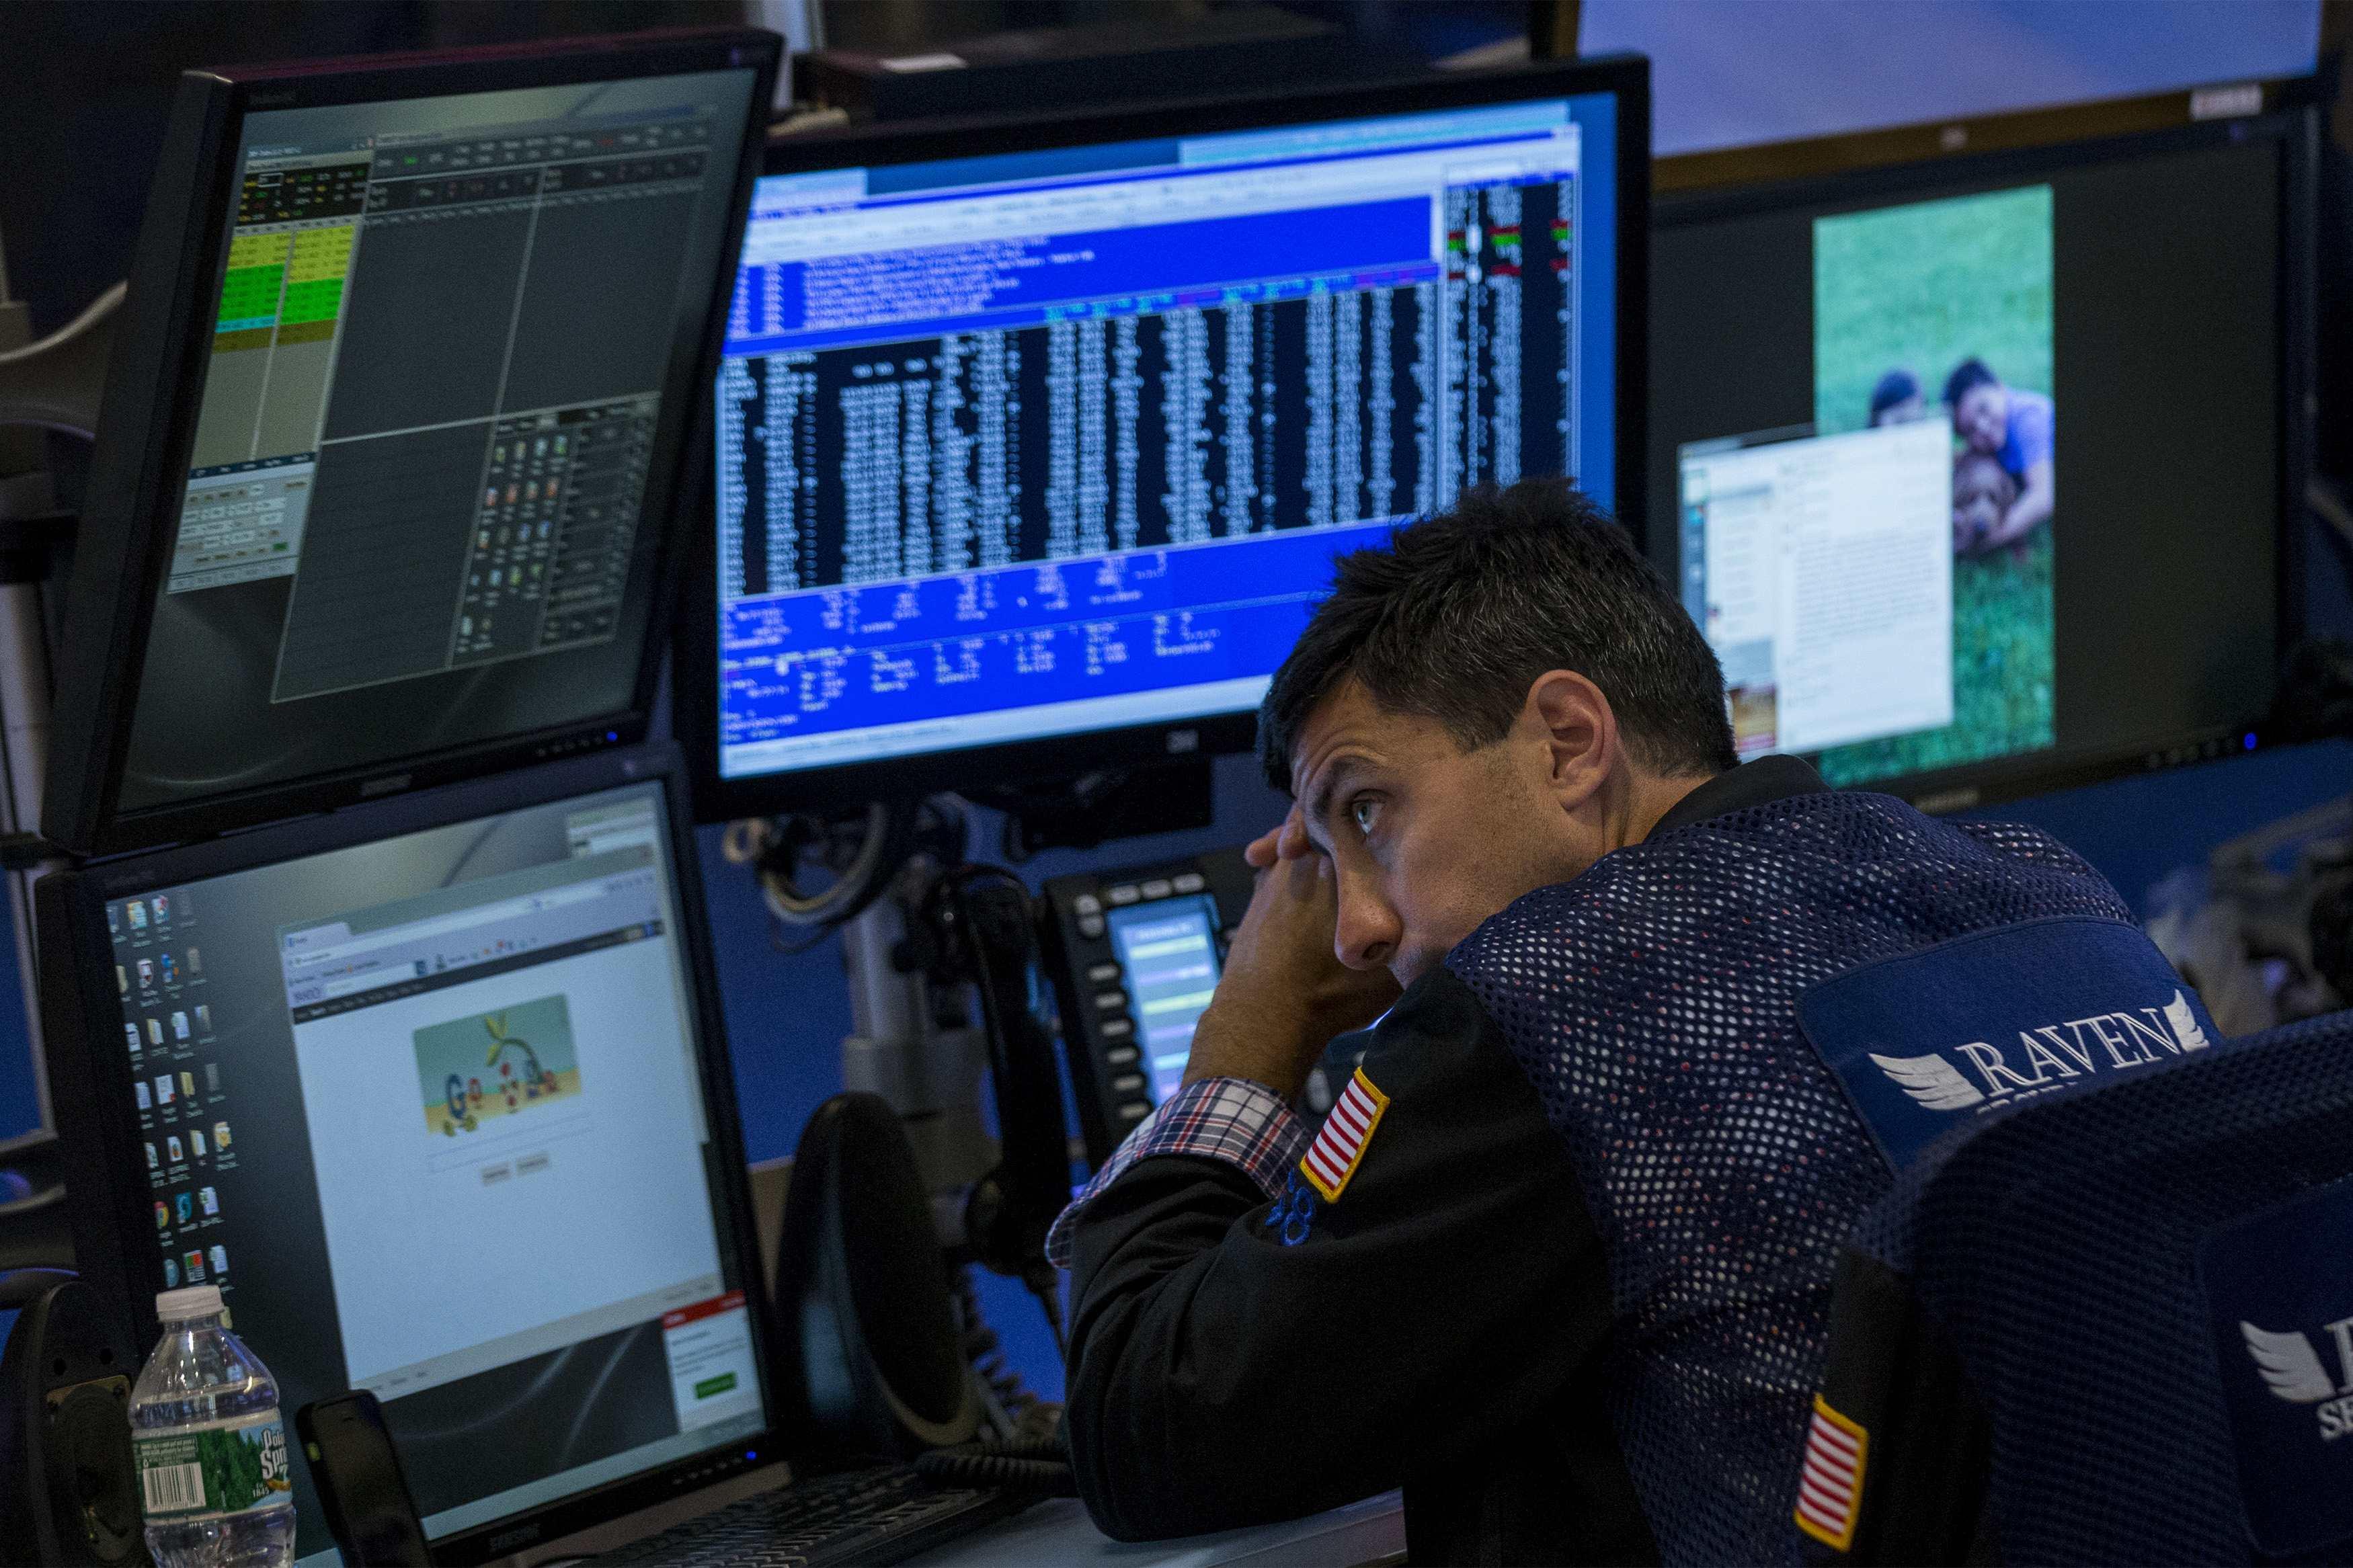
Bareksa.com - The S&P 500 and Nasdaq on Friday posted their largest weekly declines since May 2012 and the Dow turned negative for the year, led down by technology stocks after a chipmaker warned of a major pullback in the industry.
The S&P closed at its lowest level since late May and right at its 200-day moving average, a key technical indicator it hasn't breached since late 2012. The moving average also coincides with an intraday low hit early in August.
The week's selloff had various catalysts, analysts said, though none were new to the market. Some pinned the slide to concern about the Federal Reserve's imminent ending of its asset purchases stimulus, as well as worries about weak economic growth, especially in Europe, and its effect on U.S. earnings.
Promo Terbaru di Bareksa
Underscoring the headwind that Europe is becoming for economic growth, Standard & Poor's on Friday lowered France's credit outlook. The negative action comes after a week of weak data out of Germany, the continent's largest economy.
Technical indicators were also to blame.
The broad selling "has been more technical in nature," said Brian Lazorishak, senior quantitative analyst and portfolio manager at Chase Investment Counsel in Charlottesville, Virginia.
He said the 200-day moving average of the S&P 500, now near 1,905, "should be a pretty decent support level. You may very well undercut that somewhat for a few days ... but there's strong support at 1,900."
Chipmakers led the decline on Friday, with the PHLX semiconductor index down 6.9 percent, the most for any day since January 2009, after Microchip Technology warned of a broad-based industry downturn.
Microchip Tech shares tumbled 12.3 percent and the SOX index entered correction territory, falling as much as 15.4 percent from a 13-year high hit less than a month ago.
The selling in the sector, and in technology in general, is a play on the weakness coming out of European economic indicators, according to John Manley, chief equity strategist at Wells Fargo Funds Management in New York.
"There was a rise in unfocused fear this week, but fear is getting more focused," he said, speaking of the gains seen Friday in the utilities and consumer staples stocks.
The selling had been much broader earlier in the week.
The Dow Jones industrial average fell 115.15 points, or 0.69 percent, to 16,544.1, the S&P 500 lost 22.08 points, or 1.15 percent, to 1,906.13 and the Nasdaq Composite dropped 102.10 points, or 2.33 percent, to 4,276.24.
For the week the Dow dropped 2.7 percent. The S&P and Nasdaq, down 3.1 percent and 4.5 percent, respectively, had their largest weekly drops since May 2012.
The largest percentage gainer on the S&P 500 on Friday was L-3 Communications Holdings, which rose 6.5 percent, while the largest percentage decliner was Microchip Tech.
On the Nasdaq 100 the top percentage gainer was Staples Inc , up 1.8 percent, while the largest percentage decliner was NXP Semiconductors, down 12.4 percent.
Among the most active stocks on the Nasdaq were Micron Tech , down 9.3 percent to $27.79, and Intel Corp, down 5.1 percent to $31.91.
Declining issues outnumbered advancing ones on the NYSE by 2,426 to 657, for a 3.69-to-1 ratio on the downside; on the Nasdaq, 1,971 issues fell and 729 rose for a 2.70-to-1 ratio favoring decliners.
The benchmark S&P 500 index showed 7 new 52-week highs and 43 new lows; the Nasdaq Composite recorded 17 new highs and 322 new lows.
More than 9.1 billion shares changed hands on U.S. exchanges, above the average in the past five days of 7.4 billion, according to BATS Global Markets data. (Source : Reuters)
Pilihan Investasi di Bareksa
Klik produk untuk lihat lebih detail.
| Produk Eksklusif | Harga/Unit | 1 Bulan | 6 Bulan | YTD | 1 Tahun | 3 Tahun | 5 Tahun |
|---|---|---|---|---|---|---|---|
Trimegah Dana Obligasi Nusantara autodebet | 1.201,44 | ||||||
STAR Stable Amanah Sukuk autodebet | 1.181,6 | - | - | ||||
Syailendra Sharia Fixed Income Fund Kelas A | 1.152,06 | - | - | ||||
Eastspring Syariah Mixed Asset Fund Kelas A | 1.047,01 | - | - | - | - | - |

Produk Belum Tersedia
Ayo daftar Bareksa SBN sekarang untuk bertransaksi ketika periode pembelian dibuka.

Produk Belum Tersedia
Ayo daftar Bareksa SBN sekarang untuk bertransaksi ketika periode pembelian dibuka.